

Saving in Parallel#
Every drawing action on the tkinter canvas is duplicated in PIL, depending on your experience it is either straightforward or confusing, as many commands are similar. The programmer should combine as many functions as possible to avoid scripting errors.
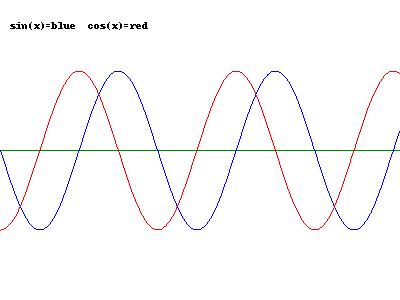
The image saved with PIL, the ps drawing should be similar, but is empty.#
Show/Hide Code parallel_save.py
# plot functions like y = sin(x) and y = cos(x)
# with Tkinter canvas and line (visible), but can be saved only in .ps format
# simultaneously use
# PIL image, draw, line (draws in memory, but can be saved in many formats)
# Python Image Library (PIL) free from:
# http://www.pythonware.com/products/pil/index.htm
# tested with Python24      vegaseat       15may2007

# use namespace to avoid conflict with PIL's Image
import tkinter as tk
import math

# needs Python Image Library (PIL)
from PIL import Image, ImageDraw

# some color constants for PIL
white = (255, 255, 255)
black = (0, 0, 0)
blue = (0, 0, 255)
red = (255, 0, 0)
green = (0,128,0)

root = tk.Tk()
root.title("Simple plot using canvas and line")

width = 400
height = 300
center = height//2
x_increment = 1
# width stretch
x_factor = 0.04
# height stretch
y_amplitude = 80

# Tkinter create a canvas to draw on
cv = tk.Canvas(width=width, height=height, bg='white')
cv.pack()

# PIL create an empty image and draw object to draw on
# memory only, not visible
image1 = Image.new("RGB", (width, height), white)
draw = ImageDraw.Draw(image1)

# create the coordinate list for the sin() curve
# have to be integers for tkinter
sine_list = []
for x in range(400):
    # x coordinates
    sine_list.append(x * x_increment)
    # y coordinates
    sine_list.append(int(math.sin(x * x_factor) * y_amplitude) + center)

# create the coordinate list for the cos() curve
cos_list = []
for x in range(400):
    # x coordinates
    cos_list.append(x * x_increment)
    # y coordinates
    cos_list.append(int(math.cos(x * x_factor) * y_amplitude) + center)

# do the tkinter canvas drawings (visible)
str1 = "sin(x)=blue  cos(x)=red"
cv.create_text(10, 20, anchor='sw', text=str1)
center_line = cv.create_line([0, center, width, center], fill='green')
sin_line = cv.create_line(sine_list, fill='blue')
cos_line = cv.create_line(cos_list, fill='red')

# Tkinter canvas object can only be saved as a postscipt file
# which is actually a postscript printer language text file
dr = cv.postscript(file="../../images/canvas/my_drawing.ps", colormode='color',pagewidth=width-1,pageheight=height-1)

# do the PIL image/draw (in memory) drawings
draw.text((10, 20), str1, black)
draw.line([0, center, width, center], green)
draw.line(sine_list, blue)
draw.line(cos_list, red)

# PIL image can be saved as .png .jpg .gif or .bmp file
filename = "..\\..\\images\\canvas\\my_drawing.jpg"
image1.save(filename)

# to test, view the saved file, works with Windows only
# behaves like double-clicking on the saved file
# os.startfile(filename)

root.mainloop()